Why “Boring” Data is Your Newest Secret Income Stream
While everyone else is busy fighting over the same saturated dropshipping niches or struggling to get a YouTube channel monetized, a quiet group of creators is making a killing with something you probably use for your grocery list: Google Sheets. You might think of spreadsheets as a tool for corporate drudgery, but for a small business owner overwhelmed by data, a well-designed sheet is a lifesaver they are willing to pay $50 to $150 for. In fact, top-tier spreadsheet developers on platforms like Etsy and Gumroad are consistently clearing $4,500 a month by selling simple, automated logic wrapped in a beautiful interface. Have you ever considered that your ability to organize a few rows and columns could be the foundation of a scalable digital empire?
📹 Watch the video above to learn more!
The Anatomy of a High-Converting Digital Dashboard
Here’s the thing: you aren’t just selling a file; you’re selling clarity. Most small business owners—think handmade candle makers, independent real estate agents, or fitness coaches—are drowning in manual data entry. They don’t need a complex, expensive SaaS subscription that costs $99 a month. They want a one-time purchase that lives in their Google Drive, doesn’t require a login, and works instantly. This is what I call the “Micro-SaaS Spreadsheet” model.
Solving the “Messy Middle” Problem
Every business reaches a point where they are too big for a notebook but too small for custom software. This is the “messy middle.” By creating a spreadsheet that automates their specific workflow, you bridge that gap. For example, an Etsy seller needs to know their exact profit after shipping, platform fees, and material costs. If you build a sheet where they just plug in the sale price and the rest calculates automatically, you’ve solved their biggest headache. The best part? You only have to build that logic once to sell it a thousand times.
Why Spreadsheets Outperform Custom Apps
You might wonder why someone wouldn’t just use an app. The reality is that apps are rigid. A Google Sheet is flexible; the user can customize it, add their own notes, and own the data forever. There’s no fear of the developer shutting down the servers or raising the subscription price. When you market your product, you emphasize this ownership and simplicity. It’s a tool that feels familiar but performs like professional software. This perceived value is exactly why these digital products sell themselves once you get them in front of the right eyes.
Your 5-Step Blueprint to Spreadsheet Sovereignty
Let me show you exactly how to transform a blank grid into a revenue-generating asset. You don’t need to be a math genius or a coder; you just need to understand basic logic and user experience. Follow these steps to go from zero to your first sale in under 14 days.
Step 1: Hunting for the “High-Pain” Niche
Don’t make a generic “budget tracker.” The market is flooded with those. Instead, go deep into a specific sub-culture. Look for niches like Airbnb Host Management, Inventory for Subscription Box Businesses, or Social Media Content Calendars with Auto-Posting Logic. Use tools like eRank or Marmalead to see what people are searching for on Etsy. If you see a high search volume for “inventory tracker for jewelry makers” but only a few high-quality results, you’ve found your goldmine.
Step 2: Engineering the Logic (The Magic Formulas)
This is where you build the engine. You’ll want to master three specific functions: QUERY, VLOOKUP (or XLOOKUP), and FILTER. These allow you to pull data from a “Data Entry” tab and display it beautifully on a “Dashboard” tab. For example, use the QUERY function to automatically create a list of items that are low in stock. This automation is what justifies your price tag. It transforms the sheet from a static table into an interactive tool that gives the user real-time insights.
Step 3: Designing for User Experience (The Aesthetic Shift)
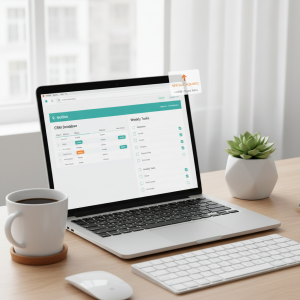
People buy with their eyes first. If your spreadsheet looks like a 1995 Excel file, it won’t sell. Use Conditional Formatting to add color-coded progress bars. Hide the gridlines (View > Show > Gridlines) to make it look like a clean interface. Use custom hex codes to create a modern color palette—think soft teals, deep charcoals, and clean whites. When a customer opens your sheet, it should feel like they’re using a premium app, not a homework assignment.
Step 4: Launching on the Right Marketplace
While you can sell on your own site, I recommend starting on Etsy or Creative Market. These platforms already have the traffic. When you list your product, your thumbnail is your most important asset. Show a high-resolution screenshot of the dashboard on a sleek laptop mockup. Use keywords like “Automated,” “Professional,” and “Easy-to-use” in your title. This is how you capture the attention of busy entrepreneurs who are searching for a quick solution to their data problems.
Step 5: Driving Traffic Without Ad Spend
The secret to scaling to $4,500 a month is organic authority. Join Facebook groups or Reddit communities related to your niche. Don’t spam your link. Instead, wait for someone to ask a question like, “How do you guys track your profit margins?” Offer a free, simplified version of your sheet in exchange for feedback. Once they see how much time it saves them, they’ll naturally want to upgrade to your full, “Pro” version. This “freemium” approach builds trust and generates consistent sales on autopilot.
The Math of a $4,500 Monthly Spreadsheet Business
Let’s look at the realistic numbers. If you price your specialized dashboard at $45—a sweet spot for most small business owners—you only need to sell 100 units a month to hit $4,500. That is roughly 3.3 sales per day. Considering that Etsy gets over 500 million visits a month, finding 3 people a day who need your specific solution is not just possible; it’s inevitable if your SEO is on point. Your initial investment is $0 (since Google Sheets is free), and your time investment is roughly 10-15 hours to build a high-quality template. After that, your only task is customer support, which usually takes less than an hour a week.
Essential Tools for Your Spreadsheet Empire
- Google Sheets: Your primary development environment (Free).
- Canva: For creating stunning listing images and PDF instructions ($12/month).
- Loom: To record a 2-minute “How-to” video for your customers (Free).
- Etsy: Your primary marketplace ($0.20 per listing).
- eRank: For keyword research to find what niches are trending ($10/month).
Common Mistakes to Avoid
- Overcomplicating the Logic: If your sheet requires a 50-page manual, it’s too complex. Keep the user input simple and the output visual.
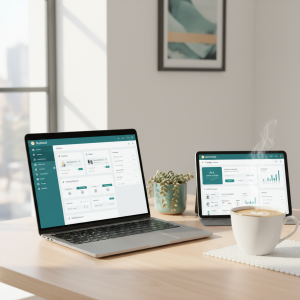
- Ignoring Mobile Users: While most work is done on desktop, ensure your dashboard is readable if they check it on their phone via the Google Sheets app.
- Bad Formatting: Never leave raw data visible on the main dashboard. Use a separate “Hidden” tab for complex calculations to keep the interface clean.
- Poor Customer Support: Digital products live and die by reviews. Respond to questions within 24 hours to maintain a 5-star rating.
Conclusion: Your Next Move
The gap between where you are and a $4,500 monthly passive income stream is simply a bit of logic and a lot of organization. You don’t need to be a tech mogul to build digital assets that pay you while you sleep. Your only job today is to identify one group of people struggling with their data. Go to Etsy right now, search for “Business Tracker,” and look for the gaps in the market. Pick a niche, open a blank Google Sheet, and start building your first dashboard. The data is waiting; are you ready to monetize it?