The Invisible Gap Between Data and Decisions
While everyone is fighting over pennies in the saturated world of generic logo design, local business owners are quietly losing thousands of dollars because they can’t read their own marketing data. Did you know that over 70% of small business owners have no idea which of their advertising channels actually generates their phone calls? Here’s the thing: they aren’t looking for another ‘marketing guru’; they are looking for clarity. By building simple, automated data visualizations, you can command a $500 setup fee for a product that takes you less than three hours to build once you have the system down.
📹 Watch the video above to learn more!
What Exactly is a Local Data Visualization Micro-Service?
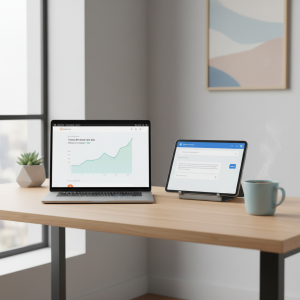
At its core, this business model involves taking messy data from Google Ads, Facebook Ads, and Google Business Profiles and turning it into a beautiful, easy-to-read dashboard. You aren’t selling ‘data’; you’re selling a ‘Single Source of Truth.’ Think of it as a digital scoreboard for a business owner’s bank account. When a plumber can see exactly how many people clicked his ad and then called his office on one screen, that information becomes addictive.
Turning Raw Numbers into Visual Stories
Most business owners feel overwhelmed by the ‘Google Analytics’ interface. It’s too complex and filled with jargon they don’t understand. Your job is to strip away the noise. You use tools like Google Looker Studio to create a visual story that highlights only the metrics that matter: leads, cost per lead, and total revenue. It’s about transformation, not just information.
The ‘Set It and Forget It’ Nature of the Product
The best part? Once these dashboards are connected to the data sources, they update automatically in real-time. You aren’t manually typing in numbers every week. You build the pipe once, and the data flows through it forever. This allows you to scale your income without scaling your hours, which is the ultimate goal of any digital asset business.
Why Local Business Owners are Your Perfect High-Ticket Clients
You might wonder why a local business would pay you $500 for a dashboard when they could ‘technically’ do it themselves. The reality is that local business owners are time-poor and tech-intimidated. They value their time at hundreds of dollars per hour, so spending ten hours trying to figure out a Google API is a massive net loss for them.
The Fear of Wasted Marketing Spend
Small business owners are often terrified that they are being ripped off by marketing agencies. Your dashboard provides a level of transparency that most agencies actually avoid. By offering this as a third-party ‘audit’ tool, you position yourself as a trusted advisor rather than just another service provider. You’re the one helping them see where their money is actually going.
The Professionalism Upgrade
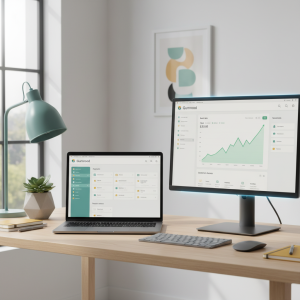
When a local contractor can pull up a professional dashboard on their iPad during a meeting, it makes them look like a Fortune 500 company. This ‘prestige factor’ is a huge selling point. You are helping them level up their internal operations, which gives them the confidence to charge more for their own services. It’s a win-win scenario that justifies your premium pricing.
Your 5-Step Blueprint to the First $2,000 Month
You don’t need a degree in data science to make this work. You just need to be one step ahead of the client. Follow this exact roadmap to land your first few clients within the next 30 days. Let me show you how to build this from scratch without spending a dime on inventory.
Step 1: Choose Your ‘High-Burn’ Niche
Focus on businesses that spend a lot on leads. Think HVAC companies, personal injury lawyers, roofers, or dental implants. These niches have high customer lifetime values and high advertising spends. If a roofer is spending $5,000 a month on ads, a $500 dashboard to track that spend is a ‘no-brainer’ investment for them.
Step 2: Master the Looker Studio Basics
Spend one weekend watching tutorials on Google Looker Studio (formerly Data Studio). It’s a free tool that is surprisingly intuitive. Learn how to connect a Google Sheet to a chart and how to ‘blend’ data from two different sources. You only need to know about 10% of the platform’s features to create a dashboard that looks like it cost thousands of dollars.
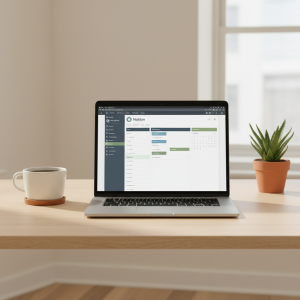
Step 3: Create Your ‘Master Template’
Don’t reinvent the wheel for every client. Create one beautiful, high-converting template for a specific niche, like ‘The Ultimate Dentist Dashboard.’ Use a professional color palette—think deep blues and clean whites—and include big, bold numbers for ‘Total Leads’ and ‘Ad Spend.’ This template will be your primary asset that you sell over and over again.
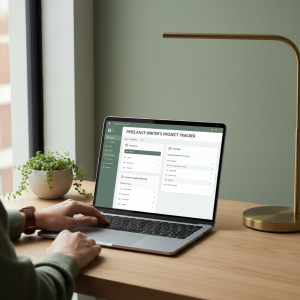
Step 4: The ‘Audit-First’ Outreach Method
Instead of cold calling and asking for money, use a tool like Loom to record a 2-minute video for a local business. Show them a ‘blurred’ version of your template and say, ‘I noticed you’re running ads, but I bet you can’t see your ROI in real-time. I built this for another client in your industry and wanted to show you how it works.’ This curiosity-driven approach has a much higher response rate.
Step 5: Scaling with Monthly Maintenance Retainers
While the $500 setup fee is great, the real wealth is in the $150/month ‘Data Maintenance’ fee. You tell the client this covers the API connection costs and a monthly 10-minute video summary you’ll send them explaining their numbers. With just 10 clients, you’ve built a $1,500/month recurring income stream that requires almost zero active work.
Realistic Earnings: From Side Hustle to Full-Time Agency
Let’s talk real numbers. In your first month, your goal should be to land two clients at $500 each. That’s $1,000 in revenue while you’re still learning. By month three, as your portfolio grows, you can easily land one client per week. Four clients a month at $500 setup plus the growing stack of $150/month retainers means you could be sitting at $3,500 to $5,000 per month within half a year. The skill level required is ‘Intermediate Beginner’—if you can use Canva and Excel, you can do this.
The Essential Toolkit for Your Dashboard Business
- Google Looker Studio: Your primary (and free) workspace for building the dashboards.
- Canva: Used to create custom background graphics and headers for your dashboards to make them look premium.
- Loom: For recording your outreach videos and monthly client reports.
- Google Sheets: The ‘middle-man’ where you will often collect data before sending it to Looker Studio.
- Supermetrics or Porter Metrics: Optional paid tools that automate the connection between Facebook Ads and your dashboard once you start scaling.
Common Pitfalls That Kill Your Profit Margins
It’s easy to get distracted by the technical side, but remember that you are a business owner first. Avoid these three mistakes to ensure your margins stay high and your stress stays low.
Over-Complicating the Design
Don’t try to show every single piece of data. If you give a plumber 50 different charts, they will never look at the dashboard again. Stick to the ‘Big Five’ metrics: Impressions, Clicks, Leads, Cost Per Lead, and Conversion Rate. Simplicity is the ultimate sophistication in data visualization.
Ignoring Mobile Responsiveness
Most business owners will check their dashboard on their phone while they are in the field or between meetings. If your dashboard only looks good on a desktop, you’ll lose the client’s interest quickly. Always use the ‘Mobile Layout’ feature in Looker Studio to ensure they can see their wins while on the go.
Failing to Automate the Data Refresh
The whole point of this model is passive income. If you have to manually update a spreadsheet every Monday morning, you’ve just bought yourself a low-paying job. Invest in automated connectors early so that the system runs itself while you sleep.
Your Next Move: Build Your First Mock-Up Today
The difference between people who make money online and those who just read about it is a single bias toward action. You don’t need a client to start. Open Google Looker Studio right now, connect it to a sample Google Sheet, and try to make one chart look beautiful. Once you see how easy it is to transform rows of numbers into a visual masterpiece, you’ll realize you’re sitting on a goldmine. Your first $500 check is just one dashboard away.